Koszyk
0
Produkt
Produkty
(pusty)
Brak produktów
Do ustalenia
Wysyłka
0,00 zł
Razem
Produkt dodany poprawnie do Twojego koszyka
Ilość
Razem
Ilość produktów w Twoim koszyku: 0.
Jest 1 produkt w Twoim koszyku.
Razem produkty:
Dostawa:
Do ustalenia
Razem
Kategorie
-
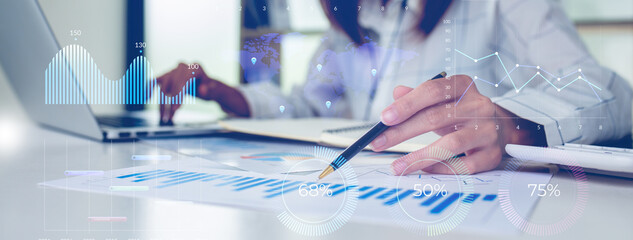
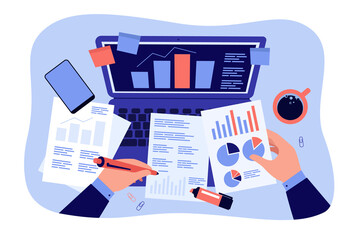
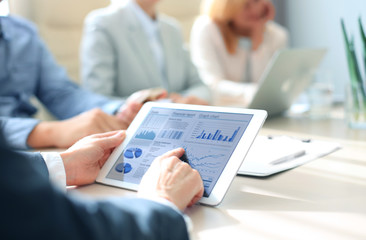
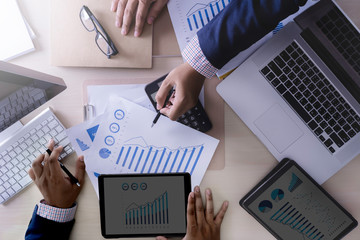
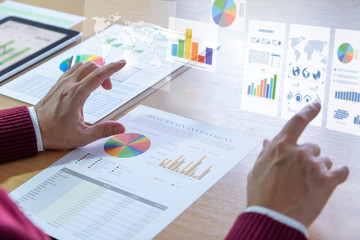
Documents, laptop and business people in office with discussion for company investment deal. Computer, paperwork and finance manager with investor client for meeting with dividend report in workplace

-
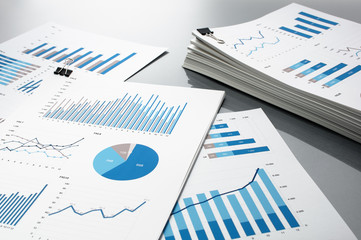
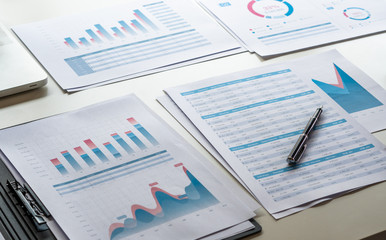
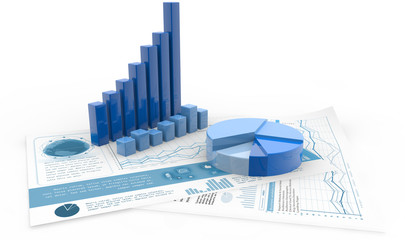
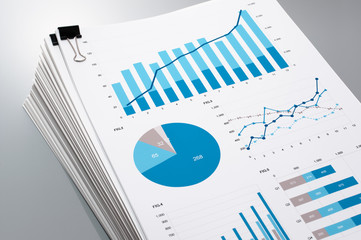
Prepareing report. Blue graphs and charts. Business reports and pile of documents on gray reflection background.
-
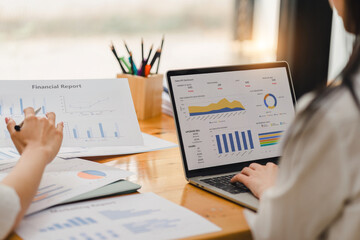
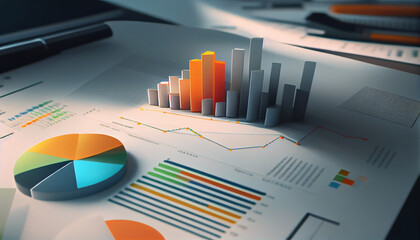
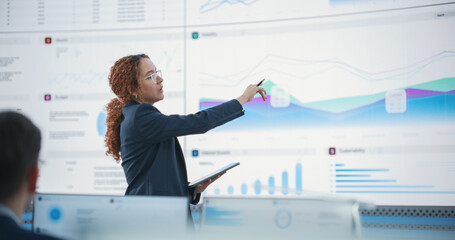
Financial Businesswomen analyze the graph of the company's performance to create profits and growth, Market research reports and income statistics, Financial and Accounting concept.
-
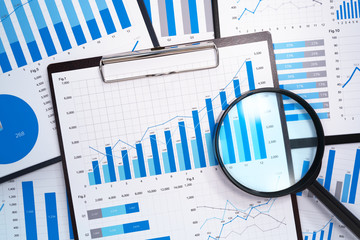
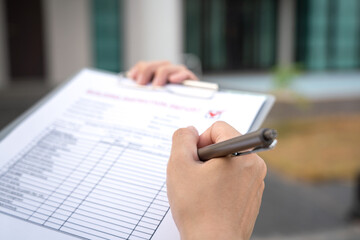
background image of a clipboard with financial report on table
-
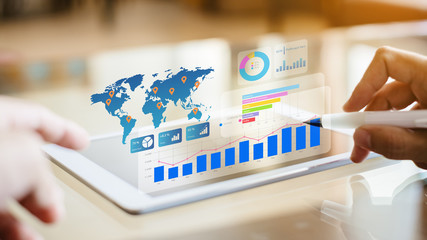
Business partnership coworkers using a tablet to analysis graph company financial budget report and cost work progress and planning for future in office room.

-
Business man hand document report paper
-
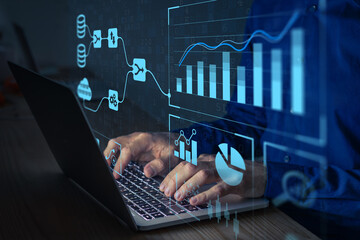
Analyst working with Business Analytics and Data Management System on computer to make report with KPI and metrics connected to database. Corporate strategy for finance, operations, sales, marketing

-
Business goal setting and strategic planning. professional analyzing financial reports and business analytics, with a glowing target and performance tracking in corporate strategy

-
Top of office workplace, hands of accountant analyzing and studying financial reports on documents, laptop screen. Vector illustration for accounting, audit, stock market trading, technology concept
-
Analyst working with Business Analytics and Data Management System on computer to make report with KPI and metrics connected to database. Corporate strategy for finance, operations, sales, marketing
-
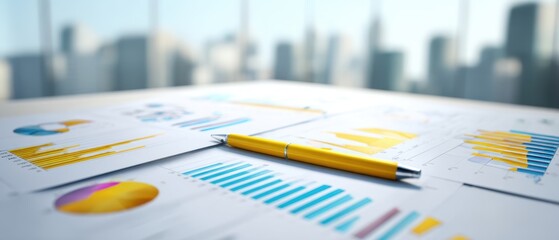
The vibrant analytical reports with charts and a pen on the office desk.
-
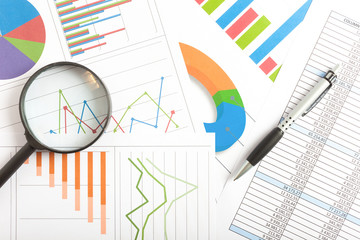
Data Examination: A magnifying glass hovers over financial reports and charts on a sky-blue surface, providing an overview of the business analysis.

-
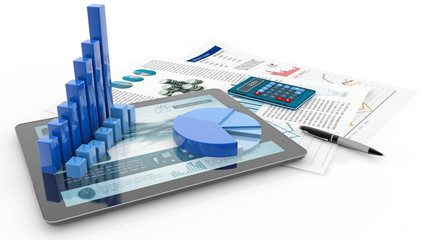
A 3D coin background with a blue finance graph and investment bar, showcasing growth and success in the market with technology and currency reports. Generative ai.

-
businessman working calculate data document graph chart report marketing research development planning management strategy analysis financial accounting. Business office concept.
-
Business team collaboration discussing working analyzing with financial data and marketing growth report graph in team, presentation and brainstorming to strategy planning making profit of company

-
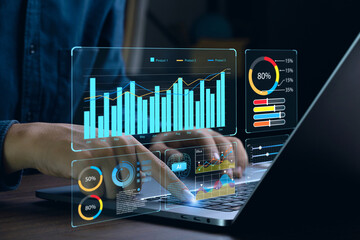
Businessman works on laptop Showing business analytics dashboard with charts, metrics, and KPI to analyze performance and create insight reports for operations management. Data analysis concept.Ai
-
bar graph, tablet and report paper isolated on white
-
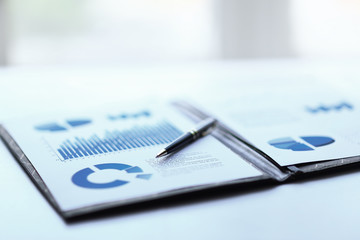
Business report. Graphs and charts. Business reports concept Ai generated image
-
Business report
-
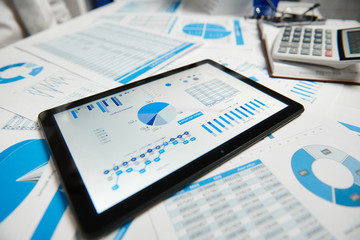
Office workspace for business. Tablet pc and reports. Table closeup. Business financial accounting concept.
-
Analyzing financial charts and data reports in modern office setting

-
Analyzing and gathering statistical data. Growth charts. Many business reports and magnifying glass.
-
extreamely close up report paper stacking of office working document , retro color tone

-
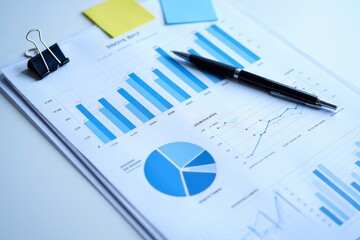
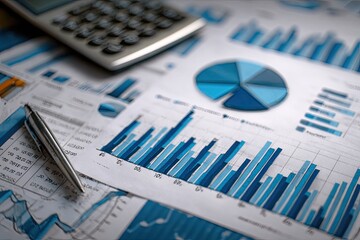
The pen resting on financial documents with a calculator and graphs.

-
Business partnership pointing to the graph of the company financial statements report and profits earned during in the computer screen with giving a presentation to colleagues in office room.

-
Two businesspeople or an accountant team are analyzing data charts, graphs, and a dashboard on a laptop screen in order to prepare a statistical report and discuss financial data in an office.
-
An analyst uses a computer and dashboard for data business analysis and Data Management System with KPI and metrics connected to the database for technology finance, operations, sales, marketing

-
Business documents with graphs, charts, and a calculator
-
Businessman investment consultant analyzing company financial report balance statement working with digital augmented reality graphics. Concept for business, economy and marketing. 3D illustration.
-
Businessman use pen to tick correct sign mark in checkbox for quality document control checklist and business approve project concept.

-
Asian businesswoman using laptop while analyzing reports in office.

-
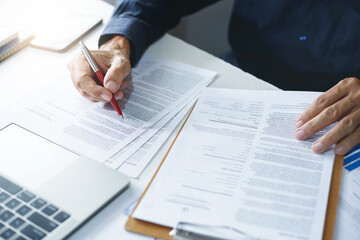
Asian businessman reviewing document reports at office workplace with computer laptop. legal expert, professional lawyer reading and checking financial documents or insurance contract
-
Topdown macro closeup of colorful business charts and data visualizations with structured statistical graphs and copy space for modern analytical reports
-
Business person analyzing financial statistics displayed on the tablet screen.
-
Successful and joyful woman at workplace checking financial reports and contracts. Businesswoman doing paperwork inside office, using laptop. Financier preparing and filling out tax forms.

-
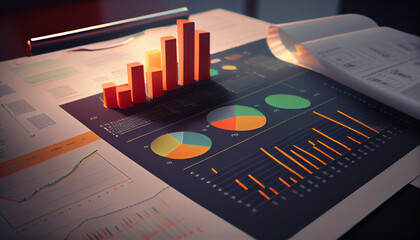
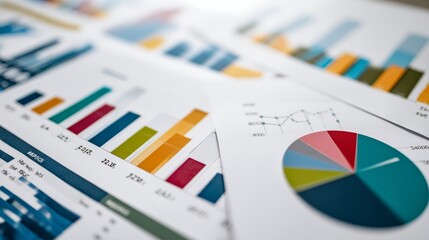
In-depth business analysis captured through vibrant pie charts and bar graphs on a document, showcasing data-driven decision making

-
bar graph, pie chart and report paper isolated on white
-
Business report. Graphs and charts. Business reports concept Ai generated image
-
Foreman's hand is using a pen checking on building inspection report form to QC building quality of the house (background). Construction industrial working scene concept. Close-up and selective focus.
-
teamwork reports accounting concept analyzing financial
-
Businessman hands checking documents file paperwork financial market, searching information on work busy desk office. Piles of document achieves with pen for sigh. Business report concept

-
Pile of documents on gray reflection background. Many graphs and charts. Concept image of data gathering.
-
Engineer writing a report on a paper clipboard

-
Hispanic Female Senior Data Scientist Reviewing Reports Of Risk Management Department On Big Digital Screen In Monitoring Room. Diverse Consulting Company Employees Working Behind Desktop Computers.
-
Result report icon set. Review document icon vector illustration. Business analysis concept.
-
Businessman interacts with augmented reality graphics while deeply reviewing a financial report for a return on investment or investment risk analysis.
-
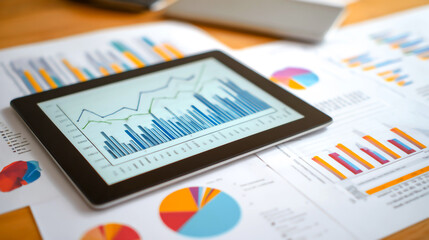
Digital financial graph on tablet displays business growth analysis. Printed quarterly reports alongside. Comparative analysis clear
-
Focused businessman checking reports and verifying office documents with calculator and paper files on table

-
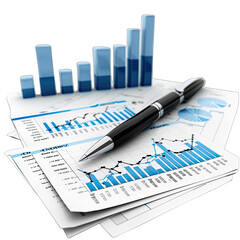
Stack of financial reports with graphs and a pen
-
Analyzing business performance with financial reports charts and graphs documents