Koszyk
0
Produkt
Produkty
(pusty)
Brak produktów
Do ustalenia
Wysyłka
0,00 zł
Razem
Produkt dodany poprawnie do Twojego koszyka
Ilość
Razem
Ilość produktów w Twoim koszyku: 0.
Jest 1 produkt w Twoim koszyku.
Razem produkty:
Dostawa:
Do ustalenia
Razem
Kategorie
-
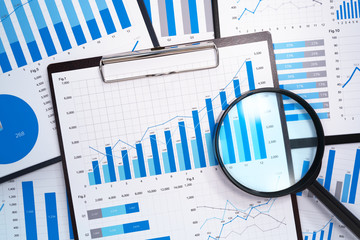
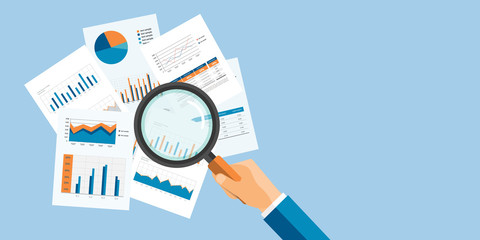
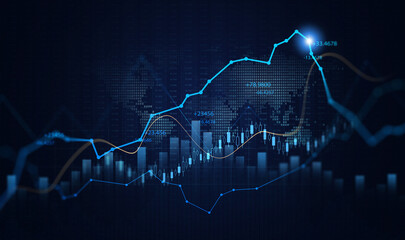
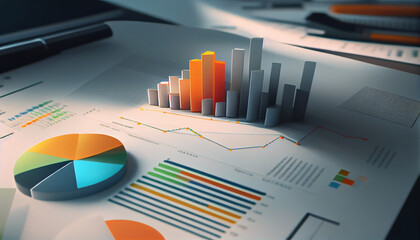
Analyzing and gathering statistical data. Growth charts. Many business reports and magnifying glass.
-
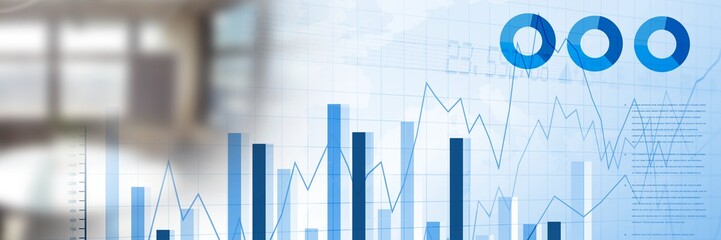
Transition effect in bar chart statistics and bright windows
-
statistique
-
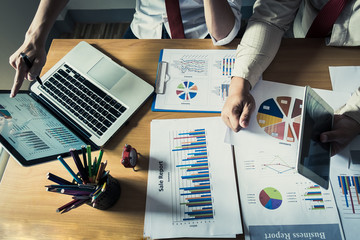
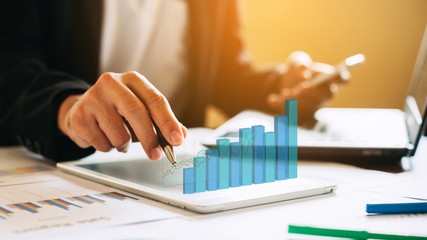
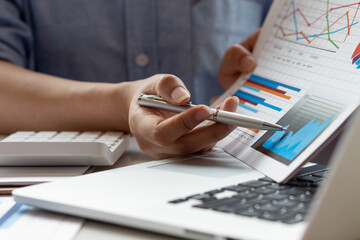
Business person analyzing financial statistics displayed on the laptop screen
-
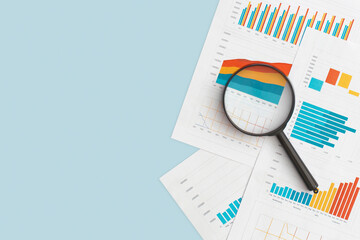
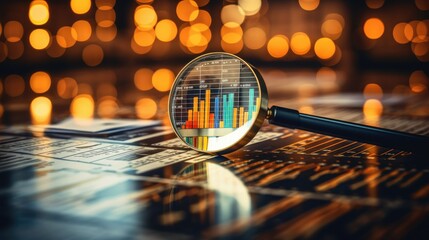
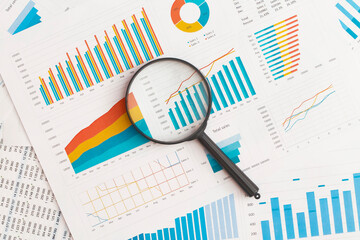
Business graphs, charts and magnifying glass on table. Financial development, Banking Account, Statistics
-
Black calculator and financial statistics on clipboard pad at office table closeup. Internal Revenue Service inspector sum check irs investigation earnings savings loan and credit concept
-
Business woman study financial market to calculate possible risks and profits.Female economist accounting money with statistics graphs pointing on screen of computer at desktop. Quotations on exchange
-
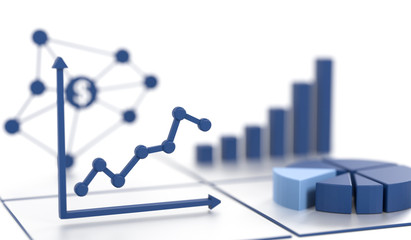
Blue growth graph business chart data diagram on success financial presentation background

-
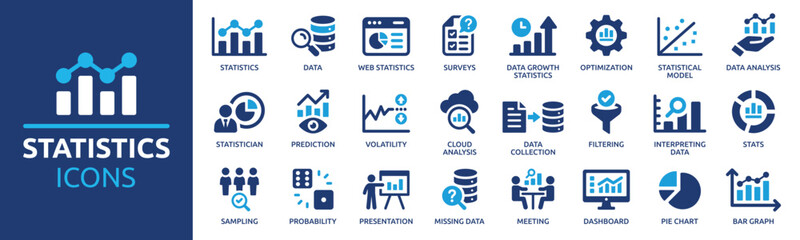
Statistics icon set. Containing data, web statistics, survey, prediction, presentation, cloud analysis and pie chart icons. Solid icon collection.
-
businessman investment consultant analyzing company financial report balance sheet statement working with digital graphs. Concept picture for stock market, office, tax,and project. 3D illustration.
-
Strategic Business Audit and Financial Management: Analyzing Data for Profitable Growth, Magnifying glass science and technology, Graphs and dashboard
-
Financial data document graph chart report statistic marketing research development planning management strategy analysis accounting. Financial business technology hologram concept. 3d rendering.
-
grafico economia, istogrammi, statistiche
-
vector web banner for business analytic finance graph report and business investment planning concept
-
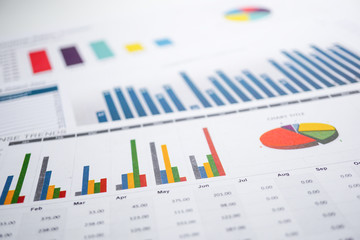
Charts Graphs spreadsheet paper. Financial development, Banking Account, Statistics, Investment Analytic research data economy, Stock exchange trading, Business office company meeting concept.
-
2024 Businesswoman analyzing company financial balance sheet working with digital virtual graphics Businessman calculating financial data for long term investment growth goals

-
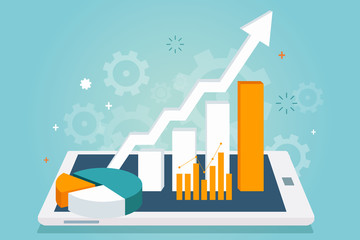
business statistics info graphics, pie charts, bar graphs, and numerical data, business growth analysis

-
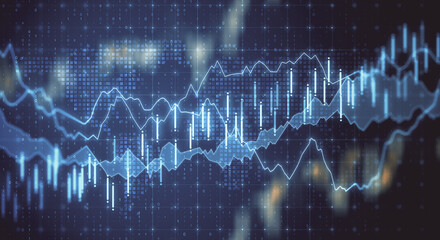
Stock market chart. Big Data. Business Graph. Investment graph. Abstract financial chart. 3D rendering.

-
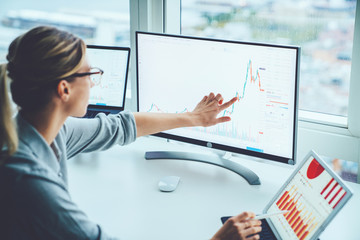
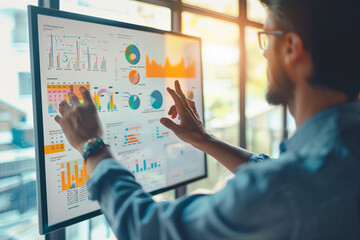
Businessman Analyzing Data on Large Screen
-
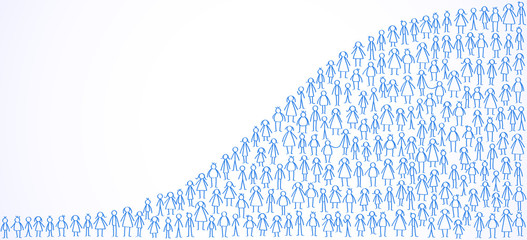
World population, stick figures forming world population statistic
-
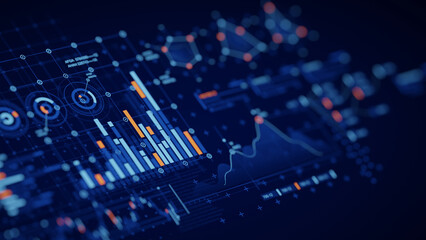
Digital screen with business statistics and stock data.
-
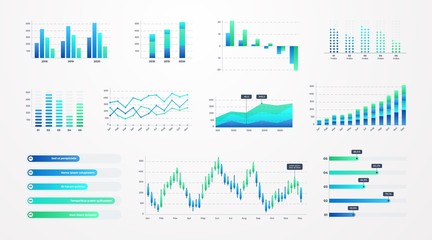
Histogram charts. Business infographic template with stock diagrams and statistic bars, line graphs and charts for presentation and finance report. Vector set charting on dashboard
-
Population demographics report, pie chart composed of people.

-
The growth of real estate investment represented by wooden houses and coins.

-
Halftone hands with graph and diagram in trendy vintage style. Concept of analytics. Achieving high results
-
Stock market business and exchange financial growth graph,nvestment finance chart graph.
-
Businesswoman examining graph on monitor in office, advertising style at sunny day. Taken from back.

-
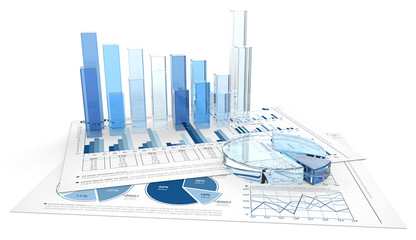
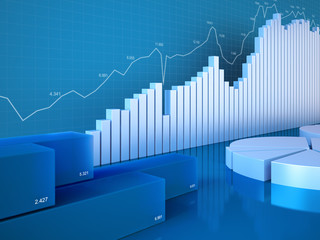
Blue Graphs and Charts. 3D render of financial documents with graphs and pie charts of glass.
-
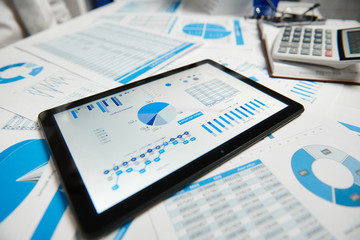
Office workspace for business. Tablet pc and reports. Table closeup. Business financial accounting concept.
-
Businessman using internet analytics in the office on the touch screen of his laptop (reduced tone)
-
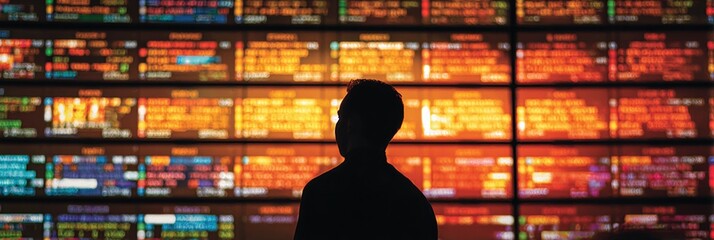
Silhouette of a Person Observing a Digital Betting Screen Filled With Colorful Data in a Sports Betting Venue During Evening Hours
-
businessman working data document graph chart report marketing research development planning management strategy analysis financial accounting. Business office concept.
-
Business graphs, charts and magnifying glass on table. Financial development, Banking Account, Statistics
-
Closeup of a laptop or notebook screen displaying colorful website traffic metrics, graphs, and analytics for blog ranking on the internet. Online visitor statistics and performanc
-
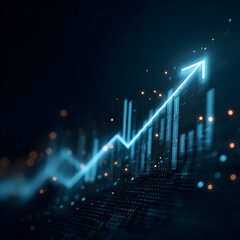
Luminous Blue Arrow Surges Upward Over a Futuristic Digital Bar Chart.
-
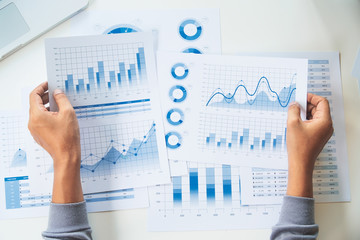
Businesswoman hands hold documents with financial statistic stock photo,discussion and analysis data the charts and graphs. Finance concept
-
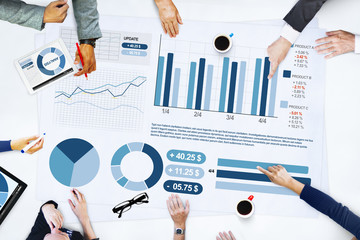
Business People Meeting Planning Analysis Statistics Concept
-
3d Diagram closeup
-
Modern infographic with statistics analytical charts. Infographics dashboard. Analytical information

-
Businesswoman analysis giving a statistic presentation in a diverse boardroom. Professional business female presenting to her work colleagues in the conference room, explaining graphics for growth.

-
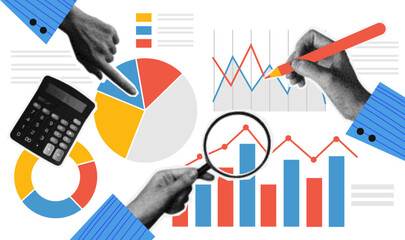
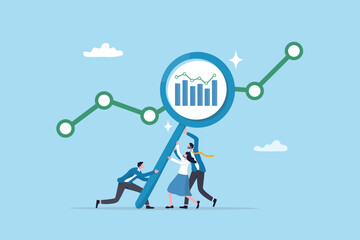
Data analysis, optimization or marketing analytics for statistics improvement, growth or KPI measurement result, chart or diagram concept, business people hold magnifying glass analyzing data chart.
-
Cropped shot of a group of businesspeople looking at graphs on digital tablets

-
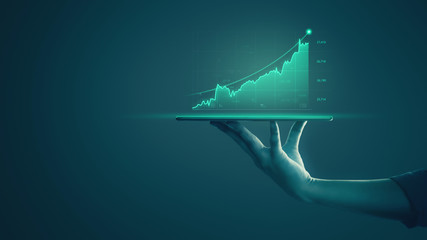
Businessman holding tablet and showing holographic graphs and stock market statistics gain profits. Concept of growth planning and business strategy. Display of good economy form digital screen.
-
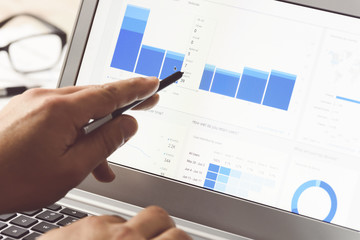
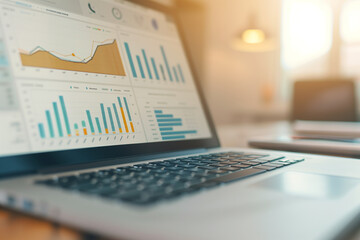
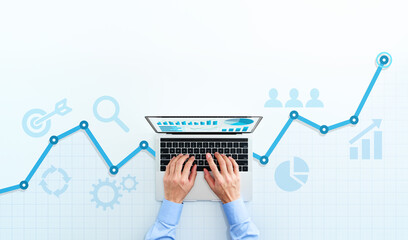
Web analytics and digital marketing. Top view of business man using laptop. Blue graphs and icons.
-
Statistics charts (Graphs, charts, statistics and reporting seri
-
Business report. Graphs and charts. Business reports concept Ai generated image
-
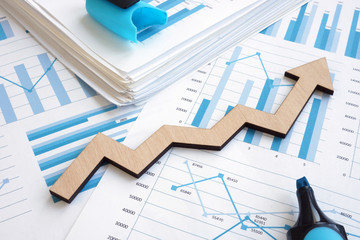
Business growth concept. Financial report with graphs and arrow.
-
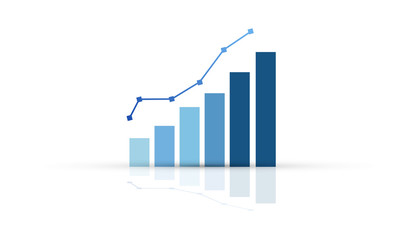
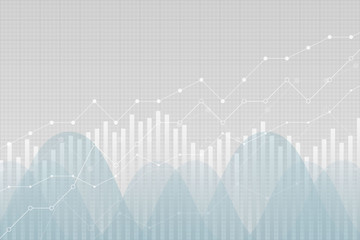
Financial statistics data graph, vector illustration. Trending lines, columns, graphic chart elements. Uptrend growth information.
-
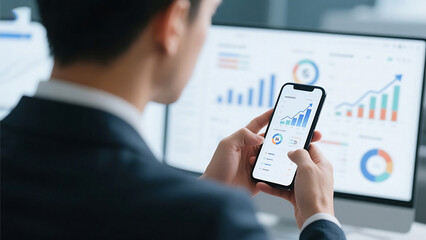
Man in suit analyzing data on phone with computer screen showing graphs and charts in the background
-
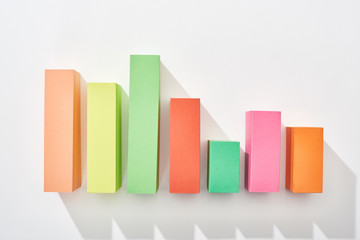
top view of color analytical graph on white background