Koszyk
0
Produkt
Produkty
(pusty)
Brak produktów
Do ustalenia
Wysyłka
0,00 zł
Razem
Produkt dodany poprawnie do Twojego koszyka
Ilość
Razem
Ilość produktów w Twoim koszyku: 0.
Jest 1 produkt w Twoim koszyku.
Razem produkty:
Dostawa:
Do ustalenia
Razem
Kategorie
-
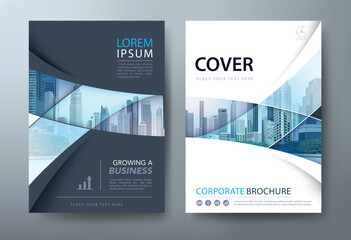
Annual report brochure flyer design, Leaflet presentation, book cover templates, layout in A4 size
-
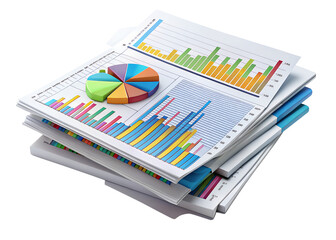
Stack of report paper documents with magnifying glass.

-
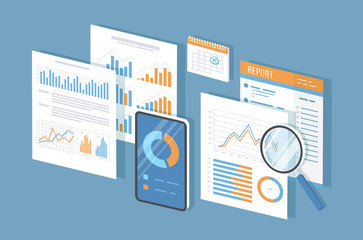
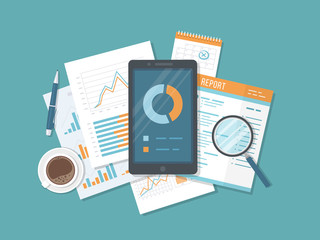
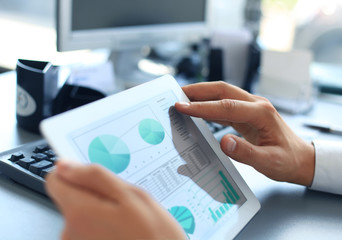
Mobile auditing, data analysis, statistics, research. Phone with information on the screen, documents, report, calendar, magnifier. Growing charts and graphics. Isometric 3d vector illustration.
-
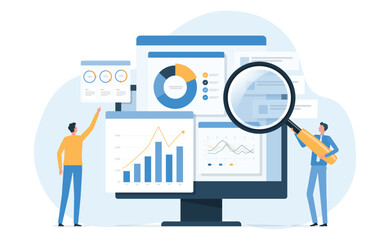
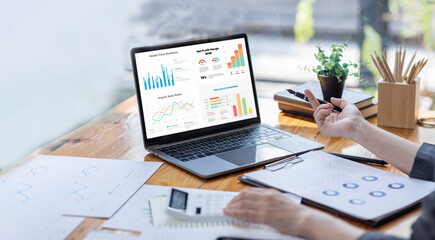
Data analyst working on business analytics dashboard with charts, metrics and KPI to analyze performance and create insight reports for operations management on virtual screen.

-
business people working for data analytics and monitoring on web report dashboard monitor and business finance investment design concept
-
Audit document icon in flat style. Result report vector illustration on white isolated background. Verification control business concept.

-
Data analytics icon set. Statistical science data information. Containing financial profit graph, database, statistics, chart, presentation, performance. Review results documents. Vector illustration
-
Business finance and investment concept, Capital gain world money economic growth. coin stack financial graph chart, market report on cash currency concept...

-
Analyst working with Business Analytics and Data Management System on computer, make a report with KPI and metrics connected to database. Corporate strategy for finance, operations, sales, marketing.

-
Analytics data stats audit research icon simple vector graphic, statistics chart results report review, profit analysis overview evaluate pictogram, quality control assess verify, sales statement

-
Businessman checking financial report

-
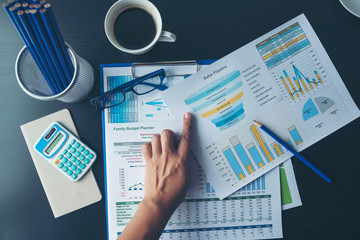
Excel Spreadsheet stats graph analytics data. Accountant hands point financial Document Trading Information with excel file. Finance statistic report analyze business graph, chart, database, report
-
Asian business adviser meeting to analyze and discuss the situation on the financial report in the meeting room.Investment Consultant, Financial advisor and accounting concept

-
Financial Businesswomen analyze the graph of the company's performance to create profits and growth, Market research reports and income statistics, Financial and Accounting concept.
-
Group of business people analysis summary graph reports of business operating expenses and work data about the company's financial statements.

-
Business People Meeting to analyse and discuss and brainstorming the financial report chart data in office Financial advisor teamwork and accounting concept.

-
Business Consulting meeting working and brainstorming new business project finance investment concept.

-
Business audit stock financial finance management on analysis data strategy with graph accounting marketing or report chart economy investment research profit concept.

-
Stack of colorful business reports and charts on a clean modern desk with blurred background
-
Contract papers. Document. Folder with stamp and text. Contract signing. Contract agreement memorandum of understanding legal document stamp seal, concept for web banners, websites, infographics.

-
Professional team analyzing financial reports and data in a modern office setting, discussing strategies and insights.

-
business report and data analysis

-
Using tablet pc, Consultant between bookkeepers and accounting lawyer consultation about asset, balance sheet, stock market statistics and yearly tax law, protect business from bribery.

-
Stack of documents with binder clips on marble table, closeup

-
flat business people analytics and monitoring investment and finance report graph on monitor concept

-
Business audit stock financial finance management on analysis data strategy with graph accounting marketing or report chart economy investment research profit concept. Generative AI

-
businessman working data document graph chart report marketing research development planning management strategy analysis financial accounting. Business office concept.
-
Businesswoman examining financial reports using pen, working with charts and graphs at office desk

-
Mobile auditing, data analysis, statistics, research. Phone with information on the screen, documents, report, calendar, magnifier, coffee, pen. Growing Charts and Charts. Top view Vector illustration
-
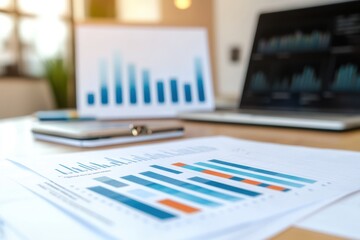
business background. financial report and laptop, on business Desk
-
Young businesswoman discussing some reports with her team

-
Business performance monitoring concept, businessman using smartphone Online survey filling out, digital form checklist, blue background.

-
Two business executives discussing financial legal papers in office at meeting. Smiling female lawyer adviser consulting mid aged client at meeting. Mature colleagues doing project paperwork overview.

-
Notebook written word Report

-
Business partnership coworkers writing cost work progress and using a tablet to analysis graph company financial budget report and planning for future in office room.

-
Analyst working on business analytics dashboard with KPI, charts and metrics to analyze data and create insight reports for executives and strategical decisions. Operations and performance management.

-
Company reports highlighting ESG metrics

-
Businessman pulling out business document from brown envelope.

-
ビジネスイメージ
-
Financial audit research online on internet web page or digital analysis and analytics electronic report vector flat, concept of accounting or sales finance market statistic inspection, quality icon

-
set of a medical clipboard on a transparent background

-
Business person analyzing financial statistics
-
Business People Meeting to discuss and brainstorming the financial report paperwork in home office. Financial advisor teamwork and accounting concept.

-
Business partners examining reports with graphs and discussing situation on market during teamwork at meeting

-
business people team analytics Data and research on web monitoring report dashboard monitor concept and finance investment graph report performance results with business meeting working concept

-
Stack of report paper documents. Concept of business and financial data analysis.

-
Financial data document graph chart report statistic marketing research development planning management strategy analysis accounting. Financial business technology hologram concept. 3d rendering.

-
business chart with pen and calculator
-
Economic pressure with a line of documents and financial reports on a desk in a modern boardroom bright, professional light for a strategic feel

-
Data analysis icon vector set. profit graph illustration sign collection. data science symbol or logo.