Koszyk
0
Produkt
Produkty
(pusty)
Brak produktów
Do ustalenia
Wysyłka
0,00 zł
Razem
Produkt dodany poprawnie do Twojego koszyka
Ilość
Razem
Ilość produktów w Twoim koszyku: 0.
Jest 1 produkt w Twoim koszyku.
Razem produkty:
Dostawa:
Do ustalenia
Razem
Kategorie
-
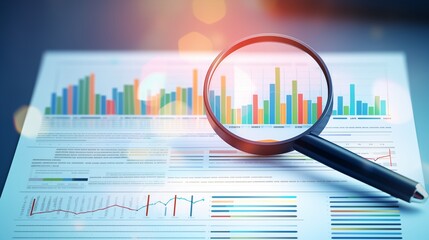
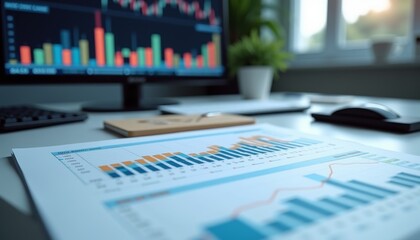
Magnifying glass and documents with analytics data lying on table,selective focus
-
Business people reading a document together. Two professionals analyse a financial report in an office

-
Papers with business report and magnifying glass
-
A blurred background with a blue finance graph and investment bar, showcasing growth and success in the market with technology currency reports chart. Business stock world economy AI computer

-
Top view of professionals shaking hands over ESG reports in a modern office.

-
To stop corruption, individuals must take action and report any suspicious activities to ensure accountability and transparency

-
Business documents analysis research financial reports charts magnifying glass sticky notes detailed data review

-
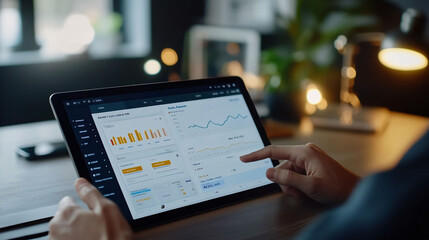
Manager touches growth graph on analytics dashboard. Business data analysis reports with marketing finance management strategy. Digital charts graphs increase business performance, sales statistic

-
Isometric 3D view of business professionals analyzing charts, reports, and data dashboards on a giant tablet, symbolizing teamwork, analytics, and corporate digital strategy

-
Businesswomen analyzing financial reports and discussing monthly budget

-
Stacks of papers documents files information business report papers, piles of unfinished document achieves with laptop computer desk in modern office, Accounting planning budget concept

-
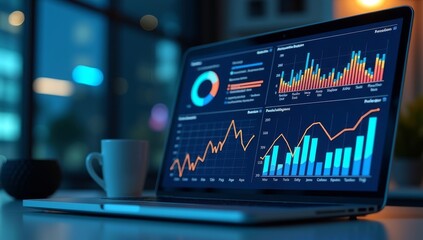
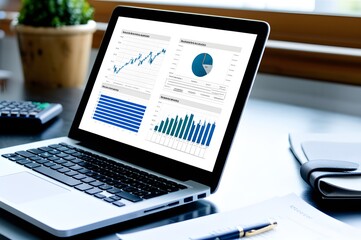
Business intelligence and analysis reports. Many graphs on reports and laptop display.
-
Analyst working in Business Analytics and Data Management System to make report with KPI and metrics connected to database. Corporate strategy for finance, operations, sales, marketing.

-
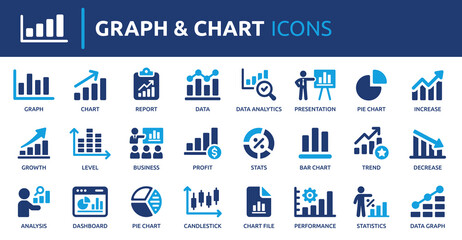
Graph and Chart icon set. Containing data, increase, growth, pie chart, data analytics, business, report and more. Solid vector icons collection.
-
Certificate document, Digital checklist, Analysis reports Statistical information documents, Businesswomen use tablets make checklist online process automation efficiently document paperless operate

-
Business man hand document report paper

-
Business Financing Accounting Banking Concept, Businesswoman doing finances and calculating financial report with business graph growth cahrt, finance and investment concept

-
In our upcoming meeting, we will use advanced analytics, collaboration tools, and strategic planning to enhance productivity and promote effective teamwork among office professionals

-
Business intelligence and analysis reports. Many graphs on reports and laptop display
-
businessman working for data analytics and monitoring on report dashboard monitor and business finance investment design concept

-
Business professional analyzing financial reports and stock performance charts on laptop in office
-
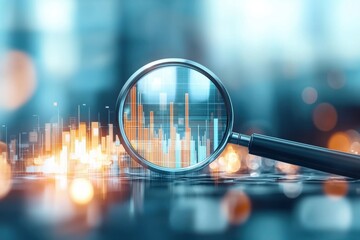
A magnifying glass focuses on colorful data visualizations, symbolizing analysis and insight in a digital environment.
-
Business woman, documents and data analytics review, human resources infographics or employee report in office mockup. Professional HR worker with paperwork, charts or statistics of payroll on banner

-
Reviewing financial reports on a tablet
-
Business audit Financial management finance management stock market audit background on analysis data strategy with graph accounting marketing or economics report chart
-
pen over financial reports
-
Focused businessman checking reports and verifying office documents with calculator and paper files on table

-
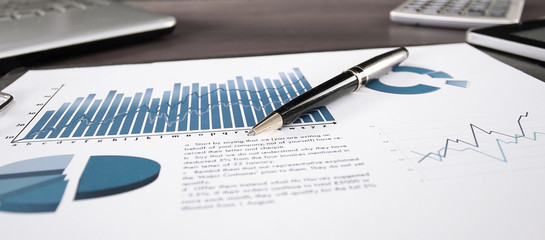
business background. financial report on the table at the businessman
-
Businessman working with modern computer calculator virtual dashboard analyzing finance sales data and economic growth graph chart and account report technology.

-
Business charts and graphs with a magnifying glass highlighting a pie chart on white paper sheets.
-
Audit, financial report and research. Document of analyze with chart of result. Icon for data, auditor and verification. Audit paper for accountant. Sheet of tax, risk and control. Vector

-
Business strategy for marketing and management. Stacked blue blocks, reports and laptop.
-
Analyzing Medical Reports on Computer

-
Data analytics automated with AI technology. Big data, business analytics and artificial intelligence automation. Dashboard report with sales and operations charts and KPI insights on touch screen.

-
Stacked financial reports with graphs and charts analysis business
-
Green business corporate responsibility sustainable environment development goal. World environment day. Businessman use computer analyze ESG Co2 Carbon footprint Emission report graph to net zero
-
business statistics info graphics, pie charts, bar graphs, and numerical data, business growth analysis

-
Blue tone financial data charts for business analysis and reporting
-
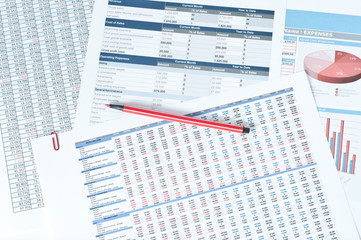
An overhead view of a desk with printed financial reports featuring pie charts and graphs, accompanied by a calculator and financial documents
-
Budget Analysis. Professional reviewing monthly financial reports in a meeting.
-
Asian businesswoman analyzing reports while working in office.

-
Realistic 3d data visualizations on financial reports bar graphs, pie charts, and line trends

-
Financier a woman with glasses works, uses a laptop, makes a report to a finance company

-
Financial Businesswomen analyze the graph of the company's performance to create profits and growth, Market research reports and income statistics, Financial and Accounting concept.
-
Businessman holding pen and pointing paper chart summary analyzing annual business report with using laptop at room office desk.

-
Accountant analyzing financial reports and graphs on a desk with computer screen in background
-
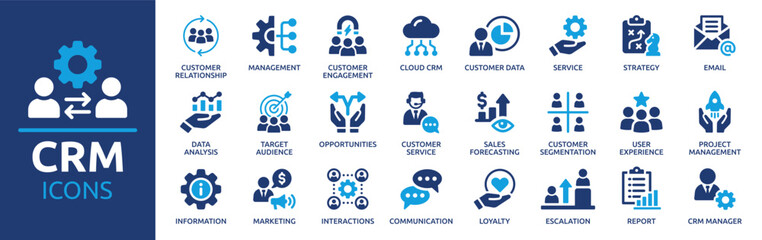
Customer relationship management CRM icon set. Containing marketing, data, report, strategy, manager, audience and more. Solid vector icons collection.
-
Two colleagues are sitting at the meeting room and discussing charts and statistics.

-
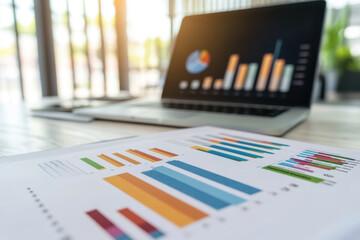
Colorful business reports on a desk with a laptop in the background
-
Clipboard icon set. Checklist on the clipboard line icon with checkmarks, checklist, document, gear, pencil. Clipboard outline icons. Checklist symbol. Editable stroke. Isolated. Vector illustration